
Today I thought I’d take a look at installing a time-series database.
As a software developer, in the past, I have set up and used various database engines (RMDBs and NoSQL types) which include Microsoft SQL Server, MySQL, PostgreSQL, SQLite, and MongoDB but something that I’ve not really looked at to date are “time-series” database engines.
In this blog, we’ll install a time-series database, specifically InfluxDB on a Ubuntu 20.04 server in addition to Grafana (we’ll use this to visualise/dashboard our data).
Time-series databases are highly optimised around “time” and “periods of time” and whilst you can achieve the same results using a traditional RMDBS or NoSQL database engine, a time-series database is specifically designed, developed and optimised for point-in-time data. I guess the simple way to think about this is that every record gets automatically assigned a timestamp at the point of insertion (think of this like the auto-incrementing “id” column that traditional database engines generally assign and use as their primary (indexed) key, this, in particular, makes time-series databases the perfect solution for IoT sensors and audit logs where point-in-time data needs to be stored and queried as efficiently as possible!
Let’s get started…
First up make sure that you have a fresh installation of Ubuntu Server – at the time of writing the LTS release/version of Ubuntu Server is 20.04
I won’t cover the operating system installation of Ubuntu Server in this post given that I’ve covered it already in other blog posts – feel free to go and check out some of my other posts if you’re not sure how to get a Ubuntu Linux server up and running or go and one-click provision a server over at DigitalOcean.
Installing InfluxDB
Please be aware that in this blog post I set up my Ubuntu 20.04 server on my “test” VLAN, the server’s IP address is 172.25.87.60 – you should replace any instances of this IP with your own server’s IP address in any screenshots or commands that I have below.
so, working on the assumption that you have a fresh installation of Ubuntu 20.04 and you’re logged into the server with a user account that has sudo rights we can now begin…
First up we’ll update our operating system packages like so:
sudo apt update && sudo apt upgrade -y
Instead of downloading InfluxDB directly from the InfluxDB downloads page we will instead add the APT repository provided by InfluxDB so that we can get updates easily in future; simply run the following commands:
wget -qO- https://repos.influxdata.com/influxdb.key | sudo apt-key add -
source /etc/os-release
echo "deb https://repos.influxdata.com/debian $(lsb_release -cs) stable" | sudo tee /etc/apt/sources.list.d/influxdb.list
We can now install the latest version of InfluxDB by running these commands:
sudo apt update && sudo apt install -y influxdbLets now install and start the service (daemon) like so, the last command will also ensure that it auto-starts each time we boot/reboot our server:
sudo systemctl unmask influxdb.service
sudo systemctl start influxdb
sudo systemctl enable influxdb.service
Now that InfluxDB is installed and the database server is running, we should be able to connect to the InfluxDB client by running the command in our terminal like so:
influx
Now that we are connected to our InfluxDB using the CLI client, we will now create a new InfluxDB database (we’ll use the name “fshub“) and, for the sake of simplicity we’ll create a database user with the name “grafana” (with full access) and grant it access to our newly created database like so:
# Create a new InfluxDB database:

create database fshub
use fshub

# Now we will create a user for this database, let's set the username to "grafana" like so (you should change the password I have used below to your own secure password too!):

create user grafana with password 'MyP4ssw0rd' with all privileges

# Now grant priviledges to the user for our 'fshub' database like so:
grant all privileges on fshub to grafana

# We check what users exist in our database by running:
show users

# Example output will appear like so:
user admin
---- -----
grafana true
The output in the terminal should look as follows:
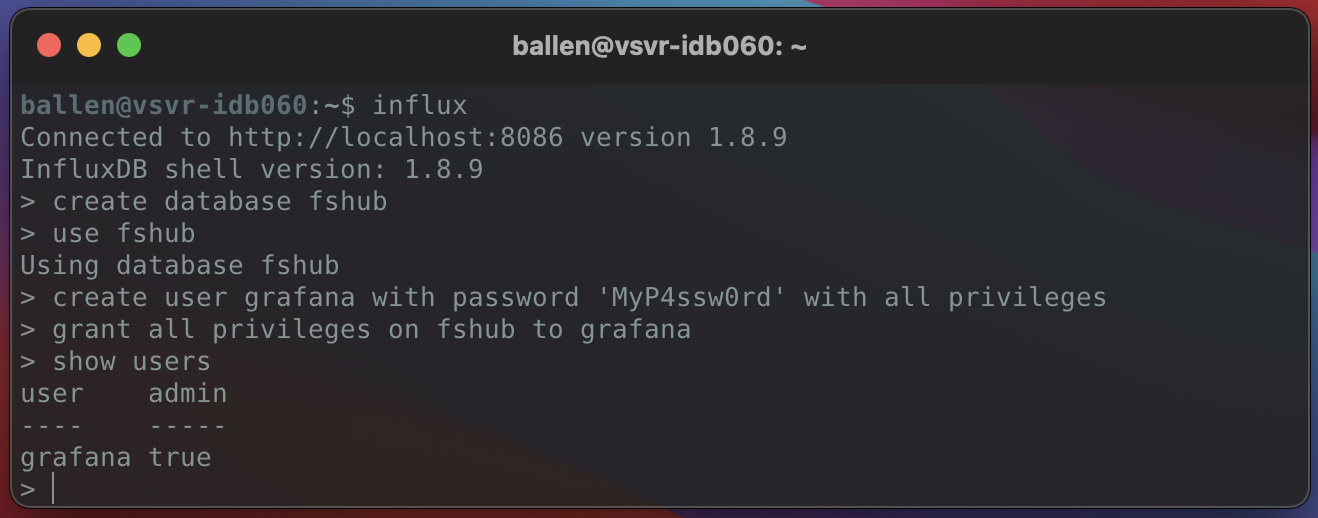
To exit out of the InfluxDB client you can type exit to quit.
Now we have a database setup and a user account with access to it, we can use the user account “grafana” to connect to our InfluxDB server from both Grafana and the Python data collector script we’ll use later in this blog post.
With InfluxDB setup and working, we can now move on to installing Grafana. Grafana is a visualisation dashboard that can be used to connect to many data sources, we will of course be using it to connect to our InfluxDB server.
Installing Grafana
The steps required for setting up Grafana are very much the same as we did for InfluxDB and so should be pretty simple to follow (assuming you didn’t have any issues in the last section).
Let’s now set up Grafana on our server…
Run the following commands to add the Grafana APT repository, update our packages and then install Grafana:
wget -q -O - https://packages.grafana.com/gpg.key | sudo apt-key add -
echo "deb https://packages.grafana.com/oss/deb stable main" | sudo tee /etc/apt/sources.list.d/grafana.list
sudo apt update && sudo apt install -y grafana
We now need to install, enable and start the service (daemon) like so:
sudo systemctl unmask grafana-server.service
sudo systemctl start grafana-server
sudo systemctl enable grafana-server.service
Assuming all went well you should now be able to login to Grafana by opening up a web browser and navigating to your server’s IP address (and the default Grafana port) like so:
http://172.25.87.60:3000
* Remember to change out my IP address above with your own 😉
You should then be greeted with the login screen as shown below, the default username and password are both: admin (at first login you will be asked to set a new password!)

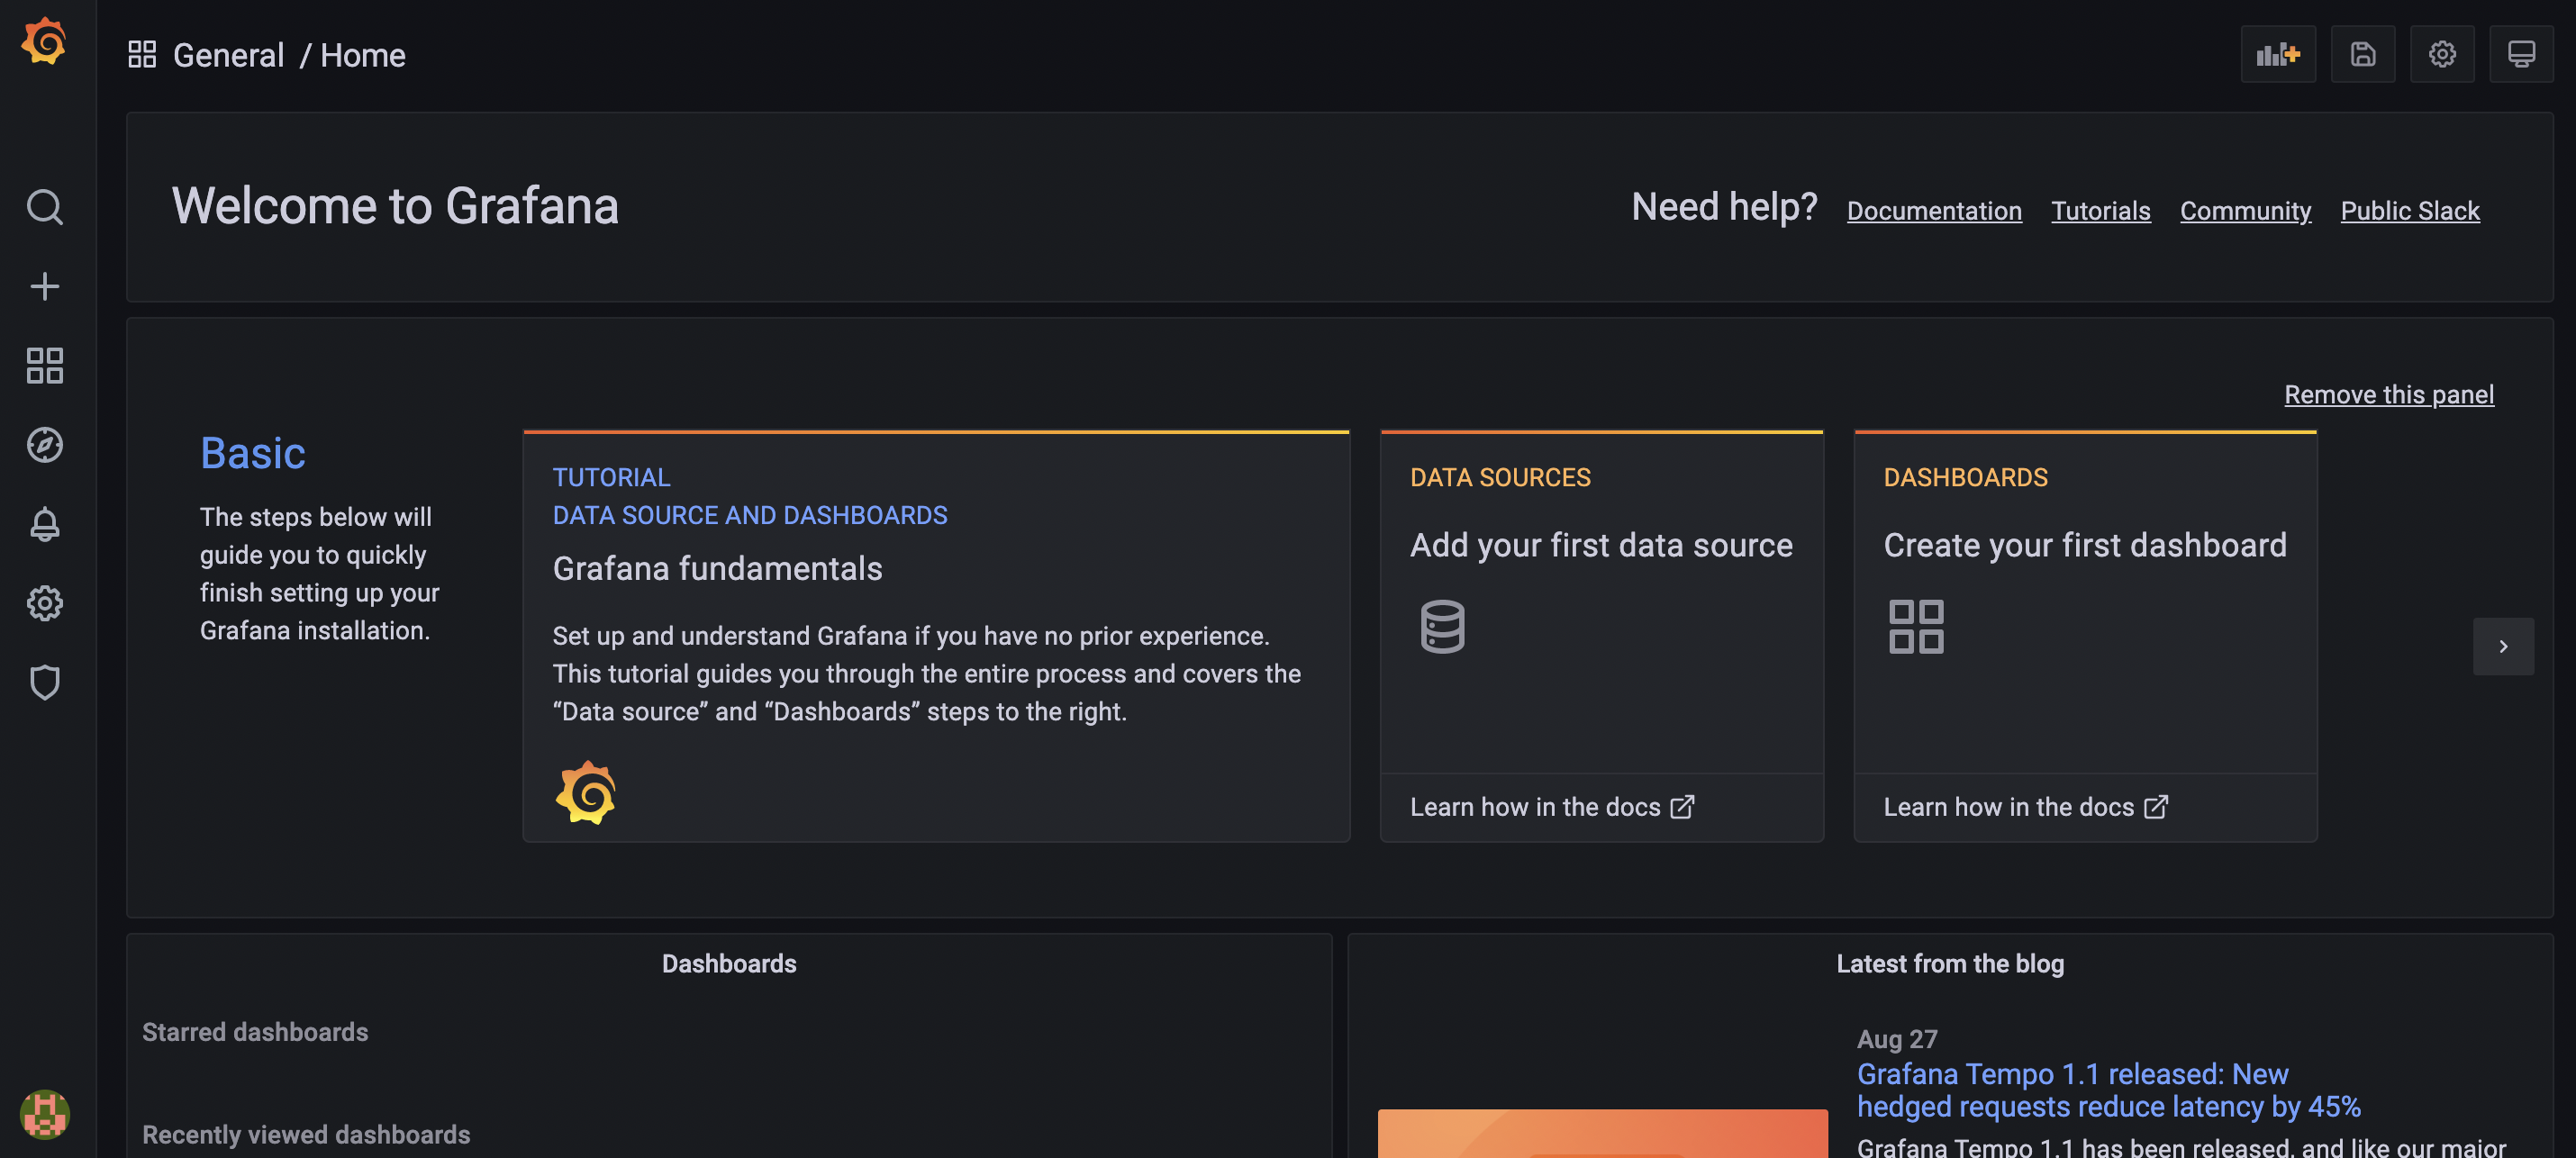
Once you have logged in and set a new password you will be taken to the main dashboard.
Now click on the “Add your first data source” section as shown here:
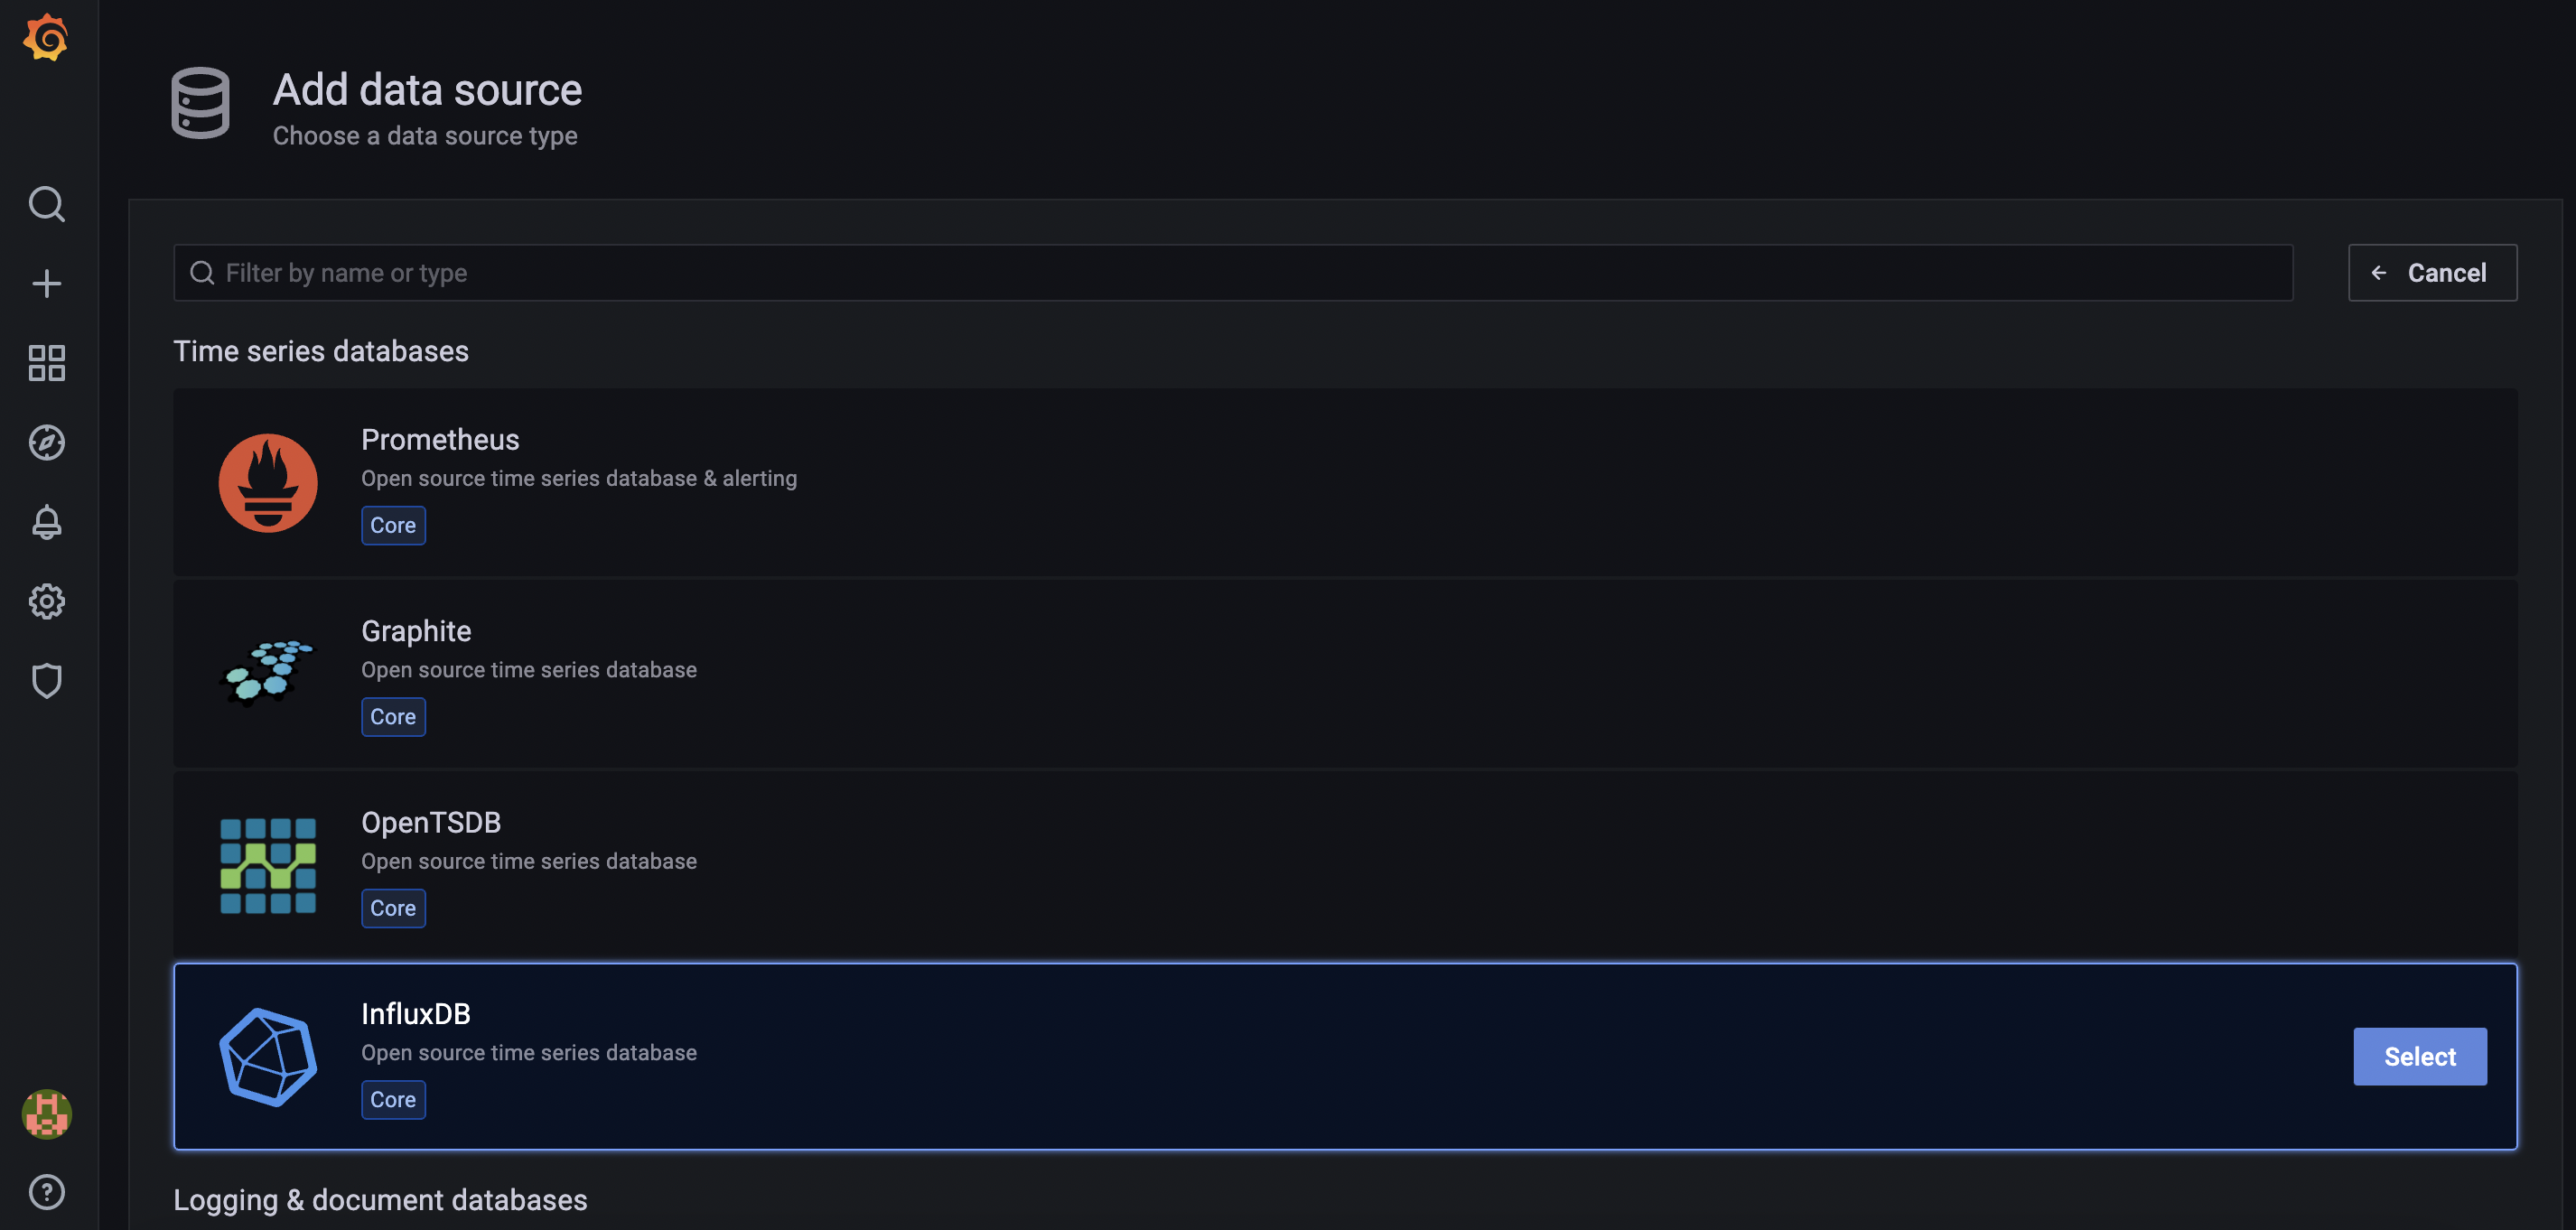
From the list of available data sources select (click the select button) under the InfluxDB option…
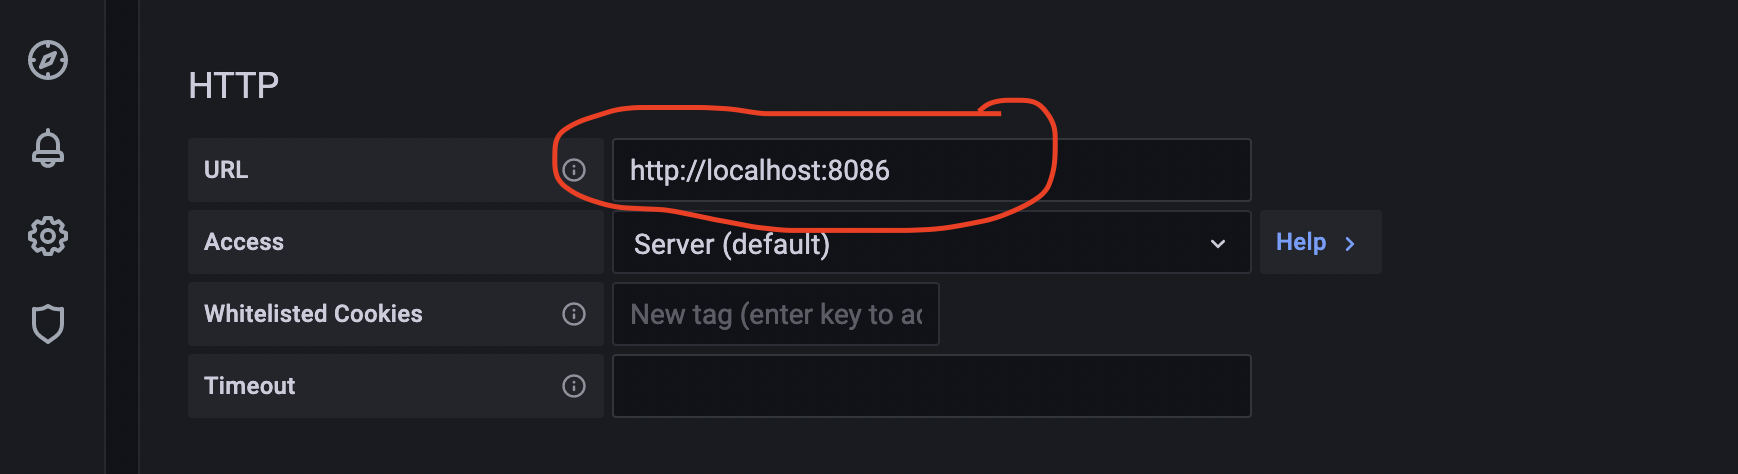
We now need to configure the data source settings, for this, you should set the following options:
Under “HTTP” section, enter the following “Access” URL: http://localhost:8086 as demonstrated below:
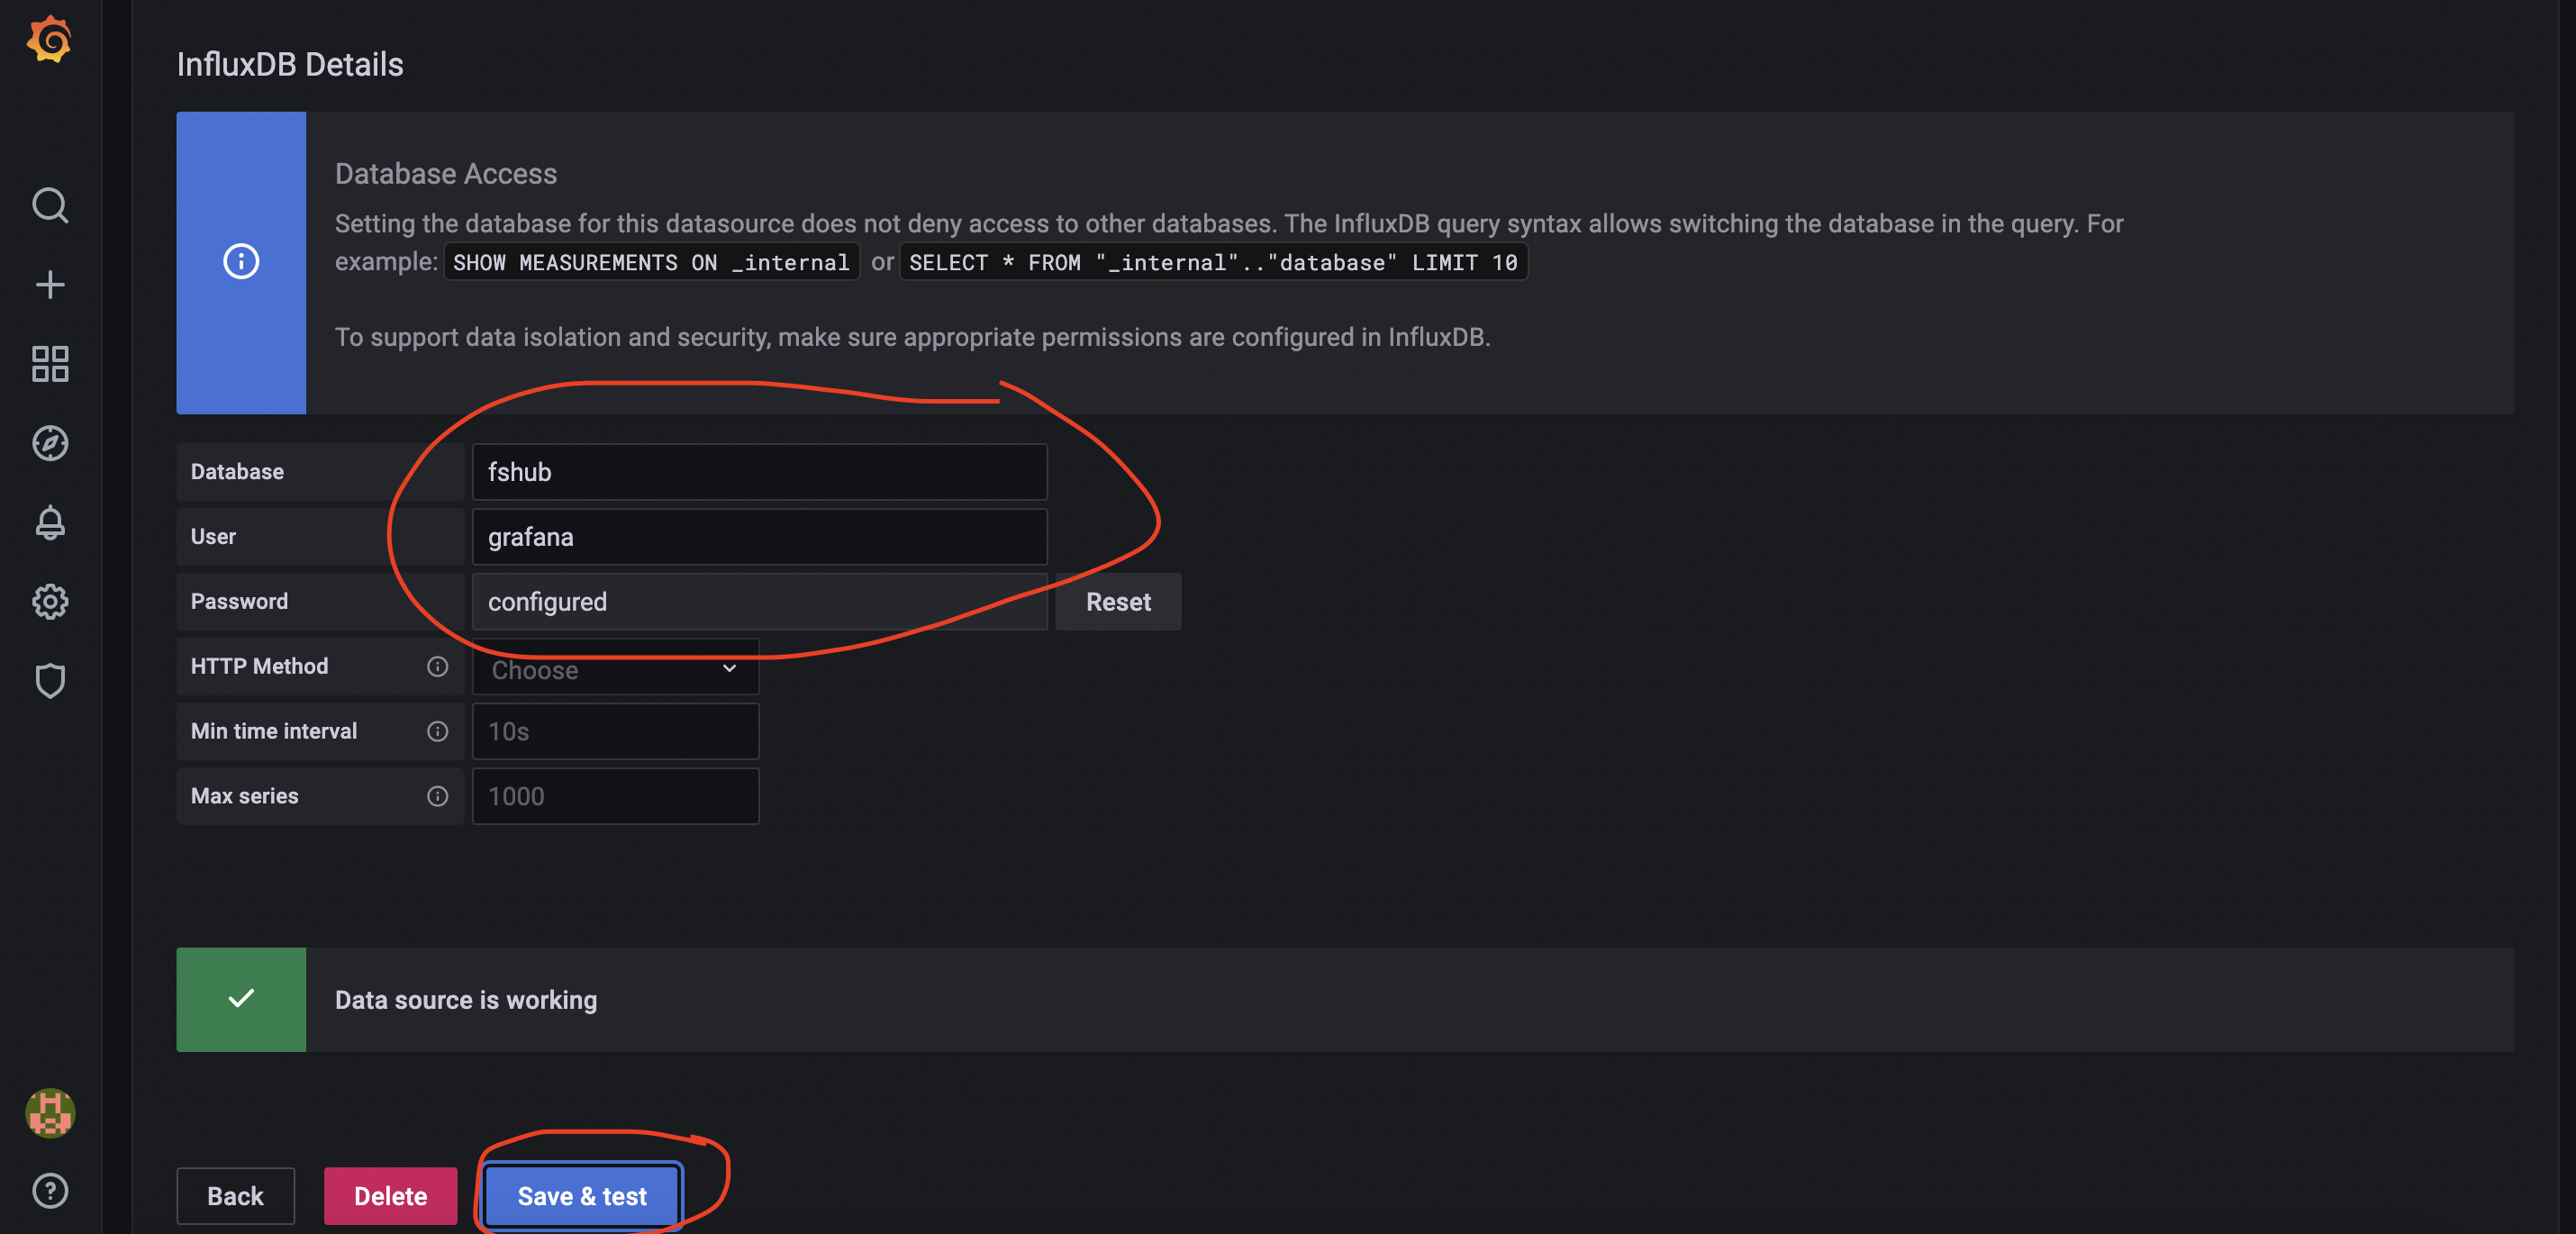
Then scroll down until you find the section named “InfluxDB Details” and be sure to set the database name (fshub), the username (grafana) and the password which you used when you creating the grafana account.
All other settings can be left as default (unless of course, you want to change anything)
Once you have set these details, click on the button named Save & test – if all went well you should see confirmation confirming that the connection was successful:
Great stuff – Grafana is now connected to our empty InfluxDB database.
Let’s now populate it with some data so that we can confirm everything is working as desired…
Time to start getting some data
For the purposes of testing and demonstrating what we can do with InfluxDB and Grafana, we will now aggregate some data from one of my own projects – FsHub is a free could-based tracking platform that I developed to record flight simulator flights from thousands of users all around the world – the platform provides a REST API to retrieve data too.
In order to obtain flight data from FsHub, we will use the before mentioned REST API to retrieve and store this flight data from the platform, with the data then stored in InfluxDB which we can then visualise using Grafana.
Sam Steele is one of the many FsHub users (of whom I presume is also very keen on InfluxDB and Grafana) has written a Python script that will connect to the FsHub REST API, download flight data and store it inside an InfluxDB.
We’ll use his Python script that is hosted on GitHub to connect to the FsHub API, collect flight data and insert it into our InfluxDB database.
Before we can run the script we must first verify that we are running a version of Python that is version 3.7.0 or higher, we can confirm this by running the following command in the terminal:
python3 --versionNext, we must install some additional Python3 modules, for the sake of simplicity we will run the following command:
sudo pip3 install pytz influxdb requests requests-cache instaloader todoist-python trakt.py publicsuffix2If you get a message saying that pip3 cannot be found, you should run this command and then re-attempt the command above:
sudo apt install python3-pip
Now that we have the required packages, let’s now download Sam’s Python3 script to our home directory:
cd ~/
wget https://raw.githubusercontent.com/allebb/personal-influxdb/master/fshub.py
…and make it executable:
chmod +x fshub.pyWe must now edit the file and set our Pilot ID, API key and InfluxDB connection details, so let’s edit the file using this command:
vi fshub.pySet the values to include your FsHub API key, your pilot ID and the InfluxDB database and user credentials like so:
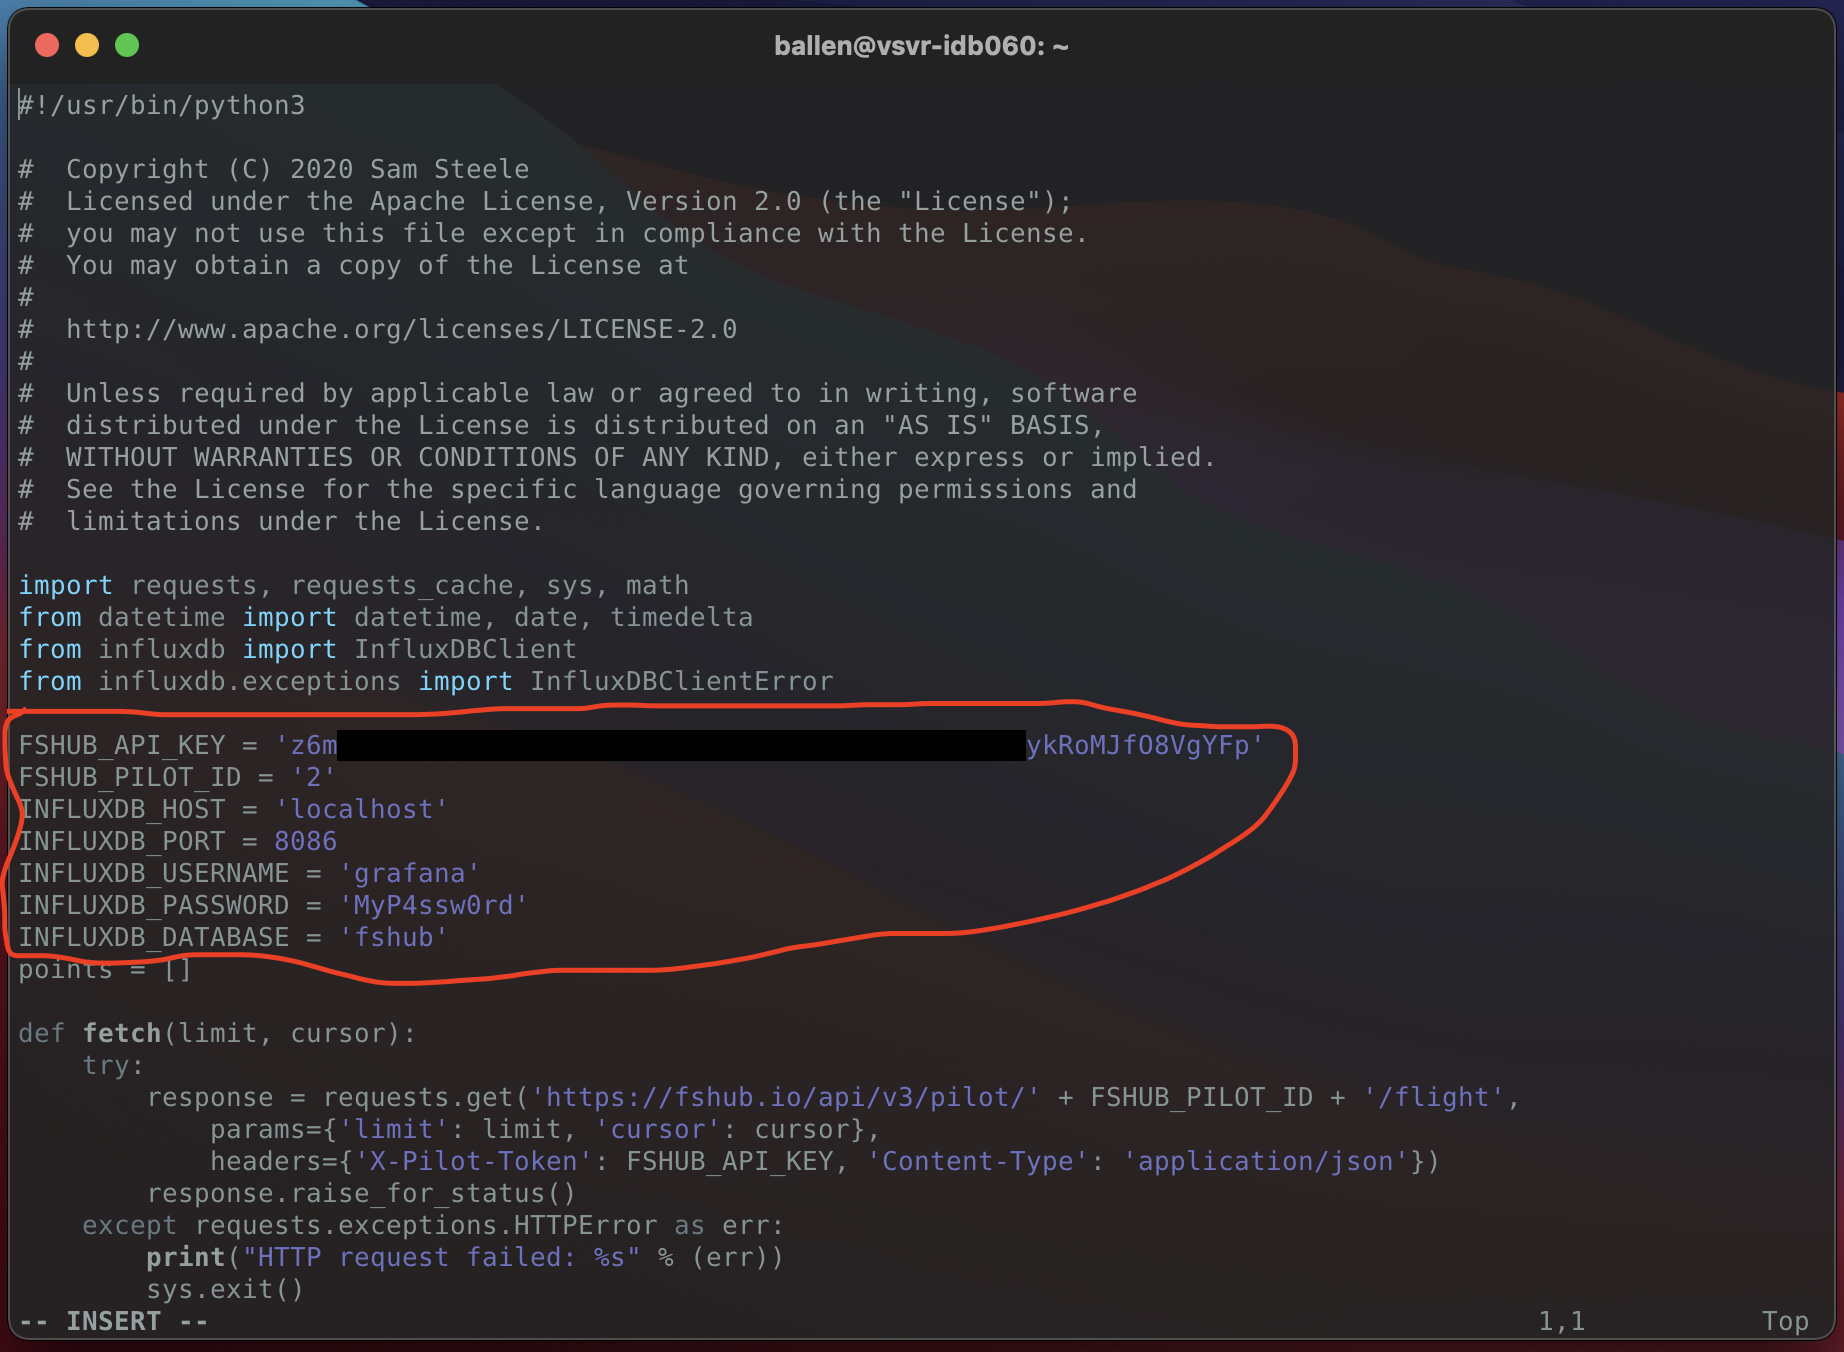
Now save the file and let’s test it out…
With our fingers crossed, let’s now run the python script like so:
./fshub.py
We should now have a ton of data inside our InfluxDB database, let’s now head back over to our Grafana installation and set up a dashboard to visualise this data…
Setting up the Grafana Dashboard
Now that we have data in our InfluxDB database we can now create a dashboard in Grafana to visualise the data that we have collected.
Sam also provides some useful dashboard configuration files in the grafaha directory in his git repository but first, before we continue though we must first install some additional Grafana plugins, let’s run the following command to get these installed:
sudo grafana-cli plugins install grafana-piechart-panel
sudo grafana-cli --pluginUrl grafana-cli --pluginUrl https://github.com/panodata/grafana-map-panel/releases/download/0.15.0/grafana-map-panel-0.15.0.zip plugins install grafana-map-panel plugins install grafana-map-panel
sudo grafana-cli plugins install grafana-worldmap-panel
As per the instructions we must now restart the Grafana service like so:
sudo service grafana-server restart
Let’s now log back into Grafana, using the “+” icon on the vertical navigation bar found on the left-hand side of the screen, hover over it and then click on “Import” from the menu that appears like so:

Next we will download the panel configuration (a JSON file) that Sam provides in his git repository.
Download the file to your computer from this URL: https://raw.githubusercontent.com/allebb/personal-influxdb/master/grafana/fshub.json (right-click this link and choose “Save As”)
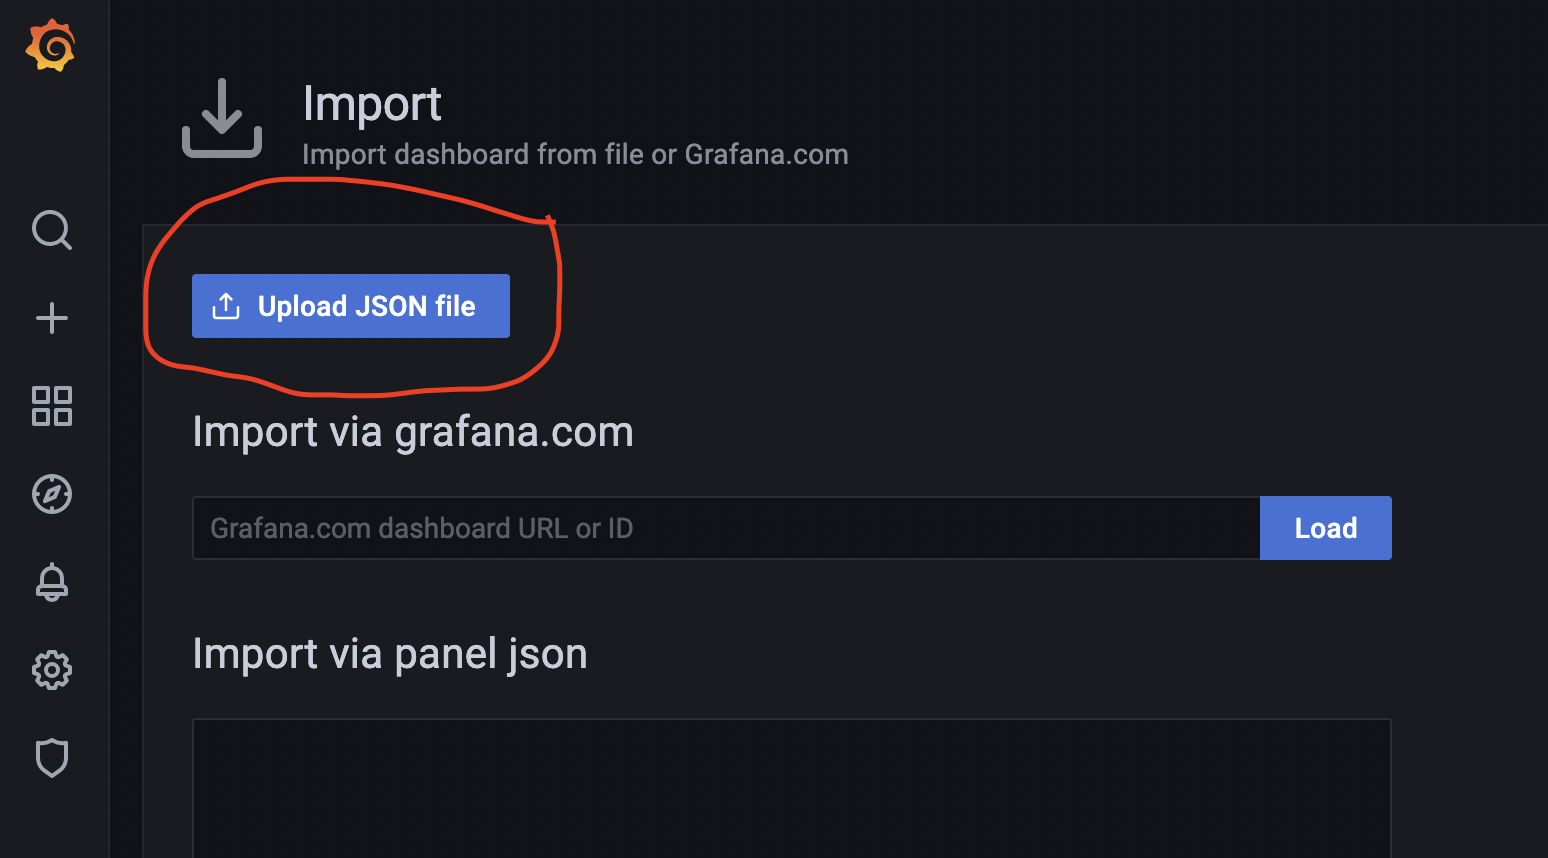
Now, back over to Grafana, we’ll use the “Upload JSON file” button and then select the file from our computer that we downloaded above:
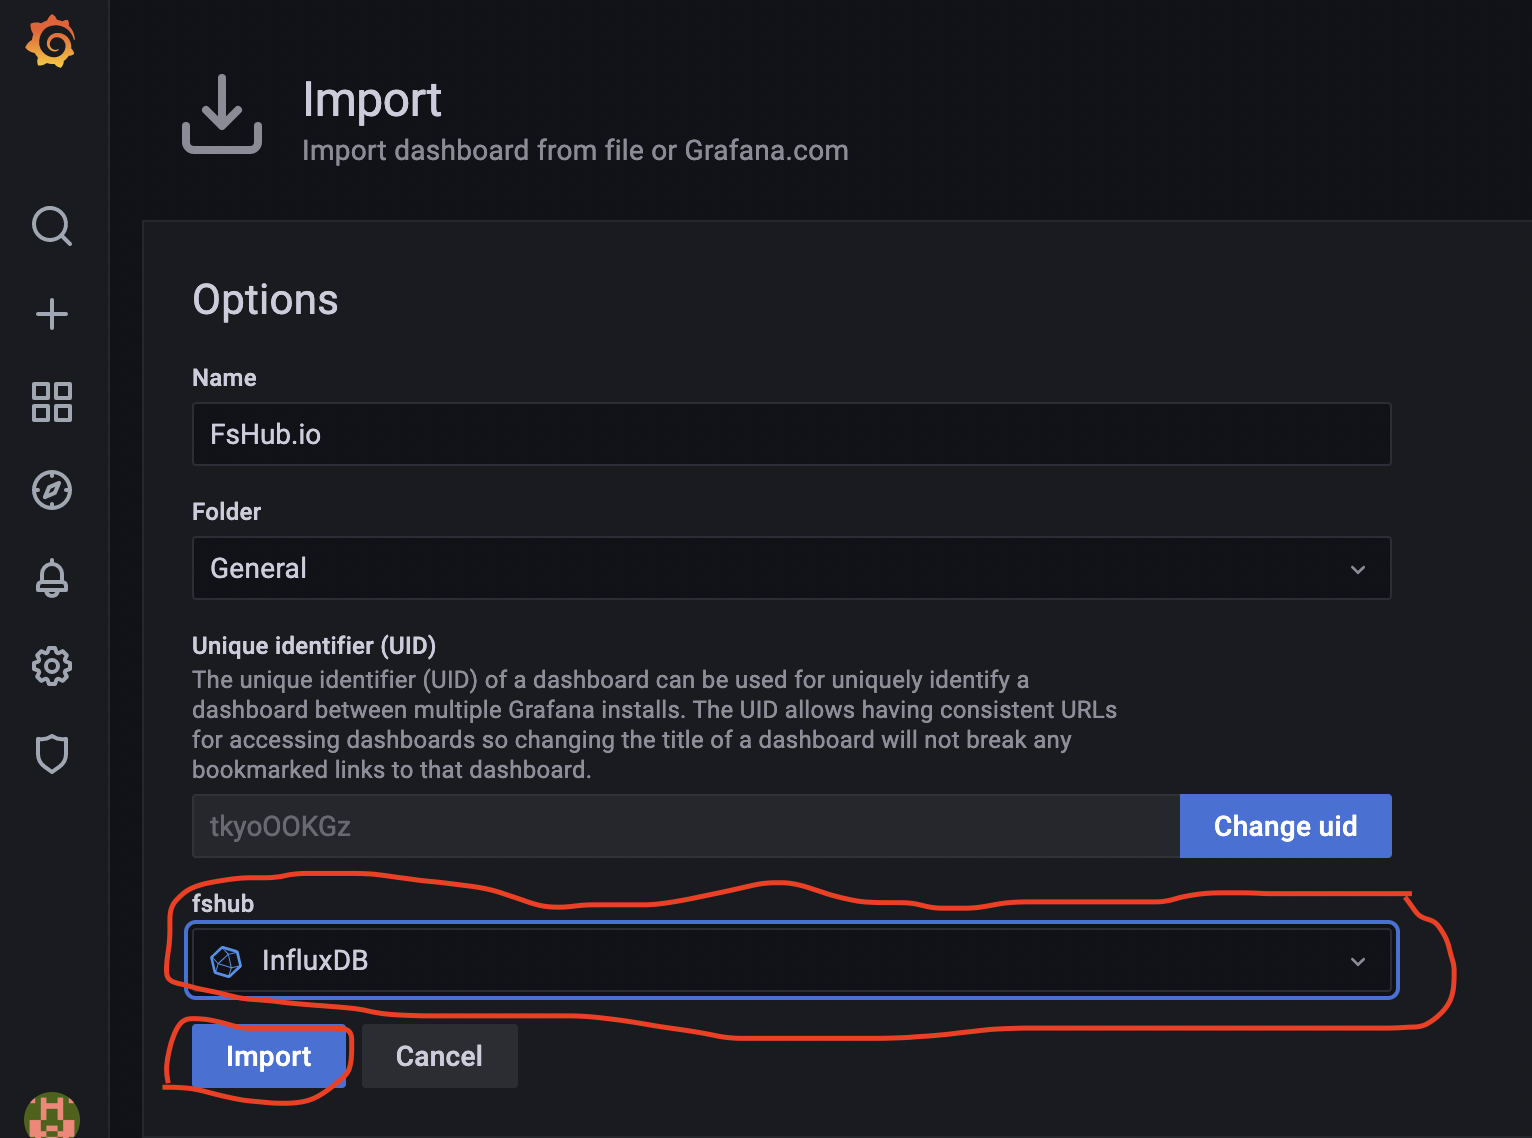
Once you have selected the downloaded JSON file and uploaded it you will then need to select the data source to use for this dashboard, use the dropdown menu as shown below to select “InfluxDB” as the data source and then click the “Import” button:
You should now be taken to the FsHub dashboard inside Grafana and if all went as planned you should now see this screen:

If you see an error message on the screen that warns you about the “grafana-worldmap-plugin” not being found simply restart the Grafana service on more time (run sudo service grafana-server restart) and then refresh your browser – you should then see the above dashboard and the world map will render correctly.
So now you’re probably wondering why you’re not seeing any data on the dashboard despite having run the python script and getting confirmation that several records have been inserted into InfluxDB…
If this is the case for you, it probably means that you’ve not made any recent flights and therefore, to view historical data we must first change the date/time range using the options at the top of the dashboard page like so:

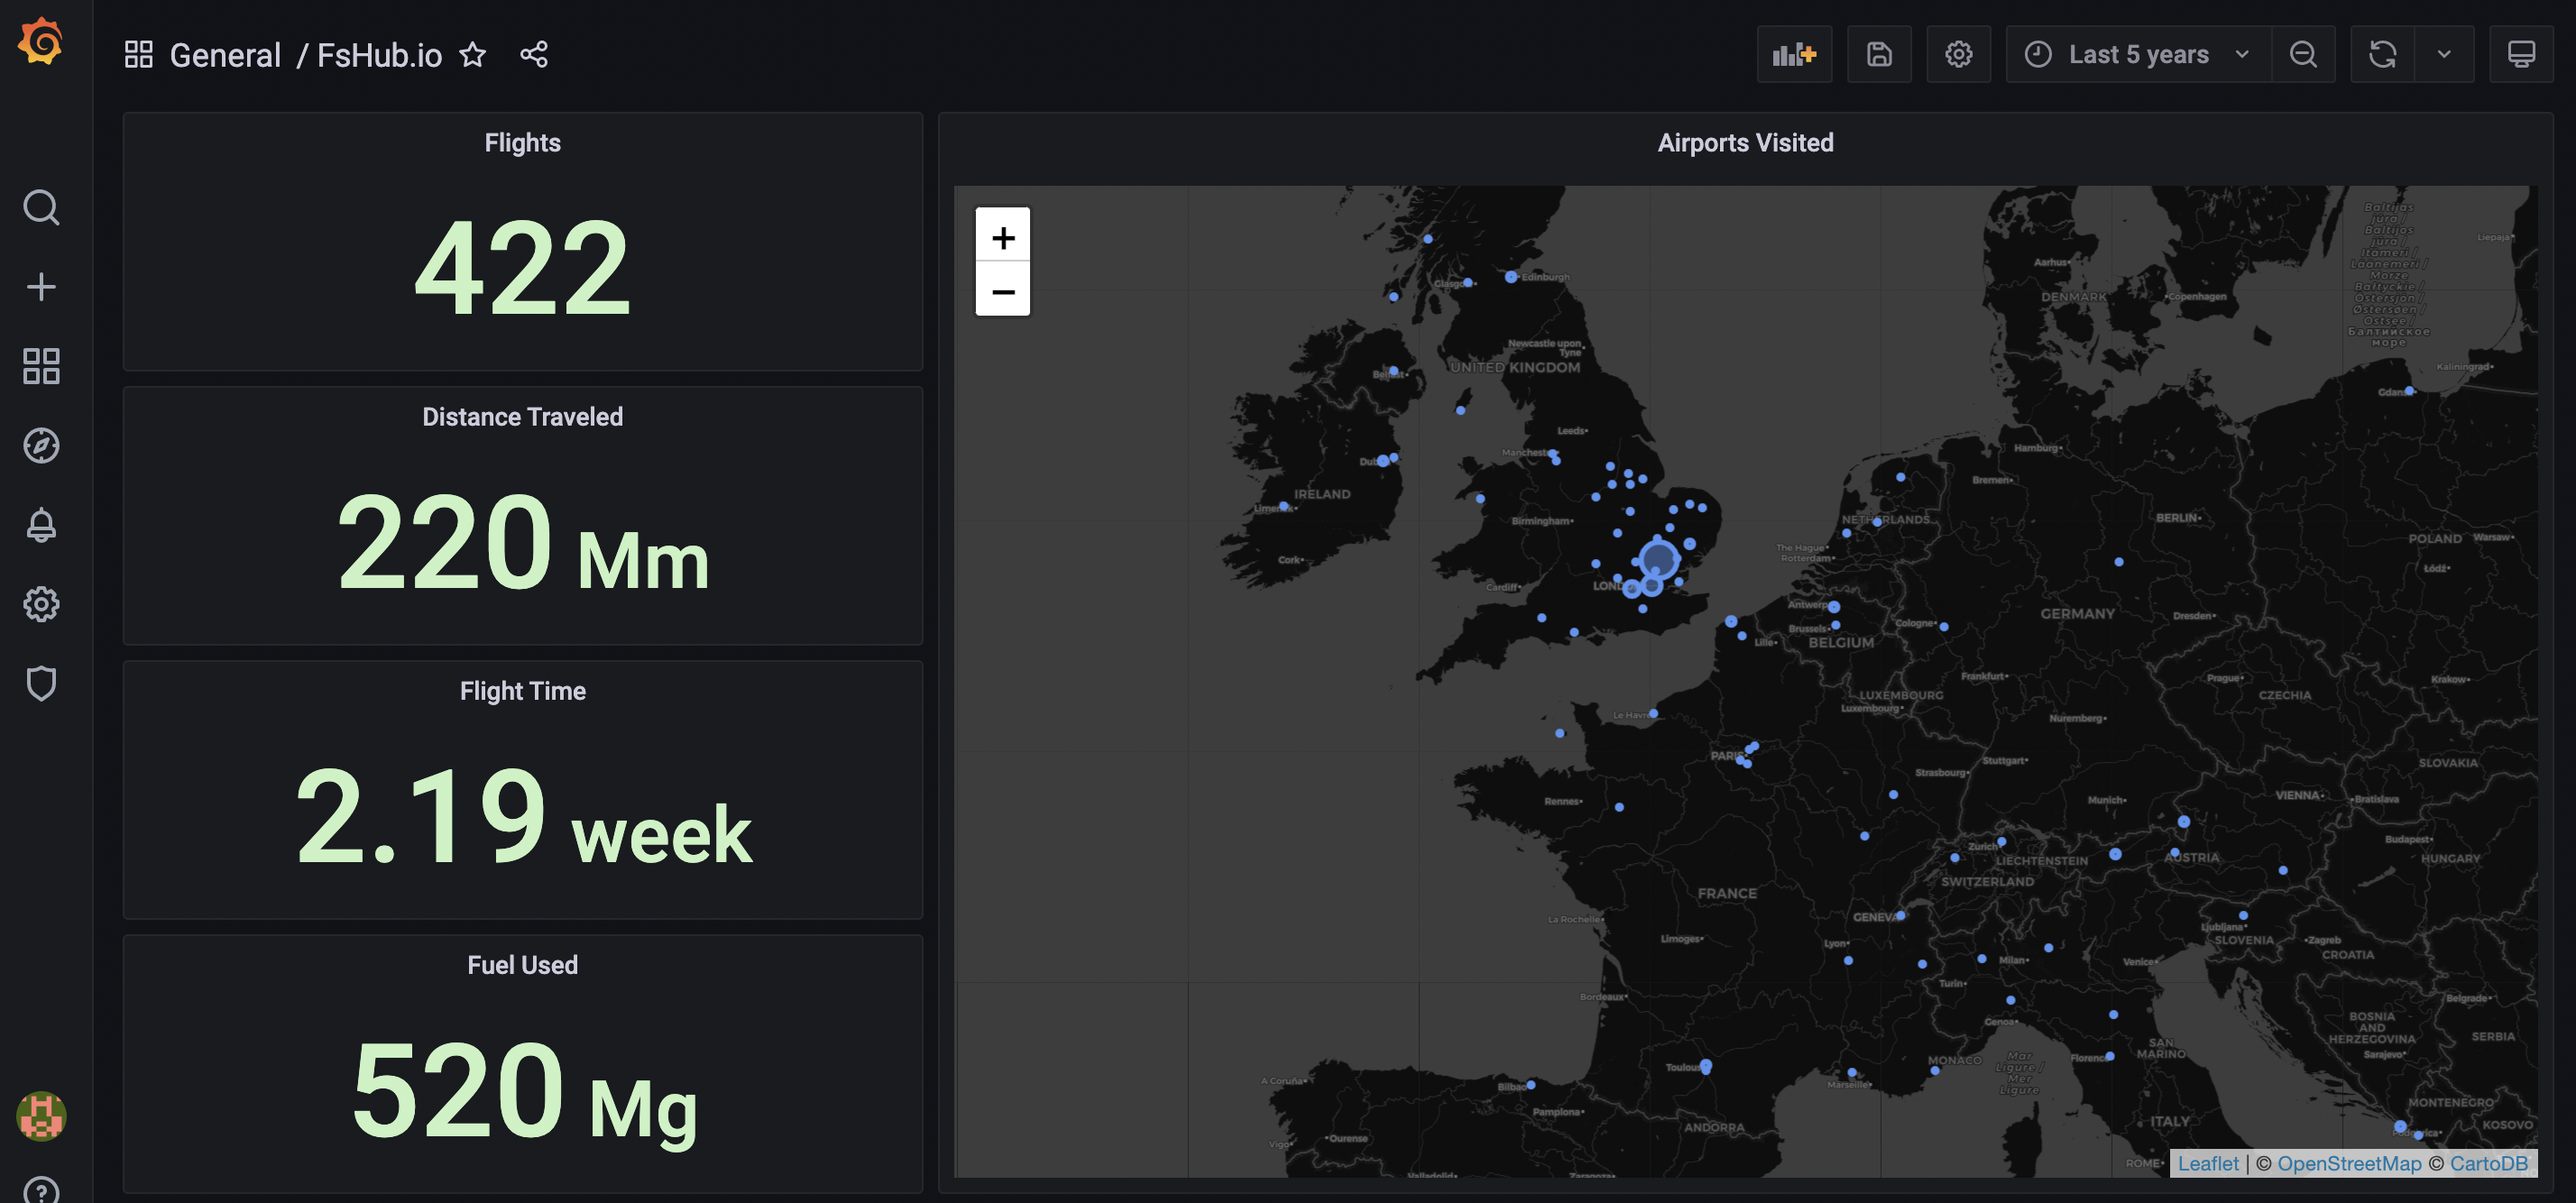
Once you have updated the time range as shown above the dashboard should automatically update and reflect all of your flights for the given time period. In my case, I updated my settings to show all flights over the last five years and this is what my dashboard shows:
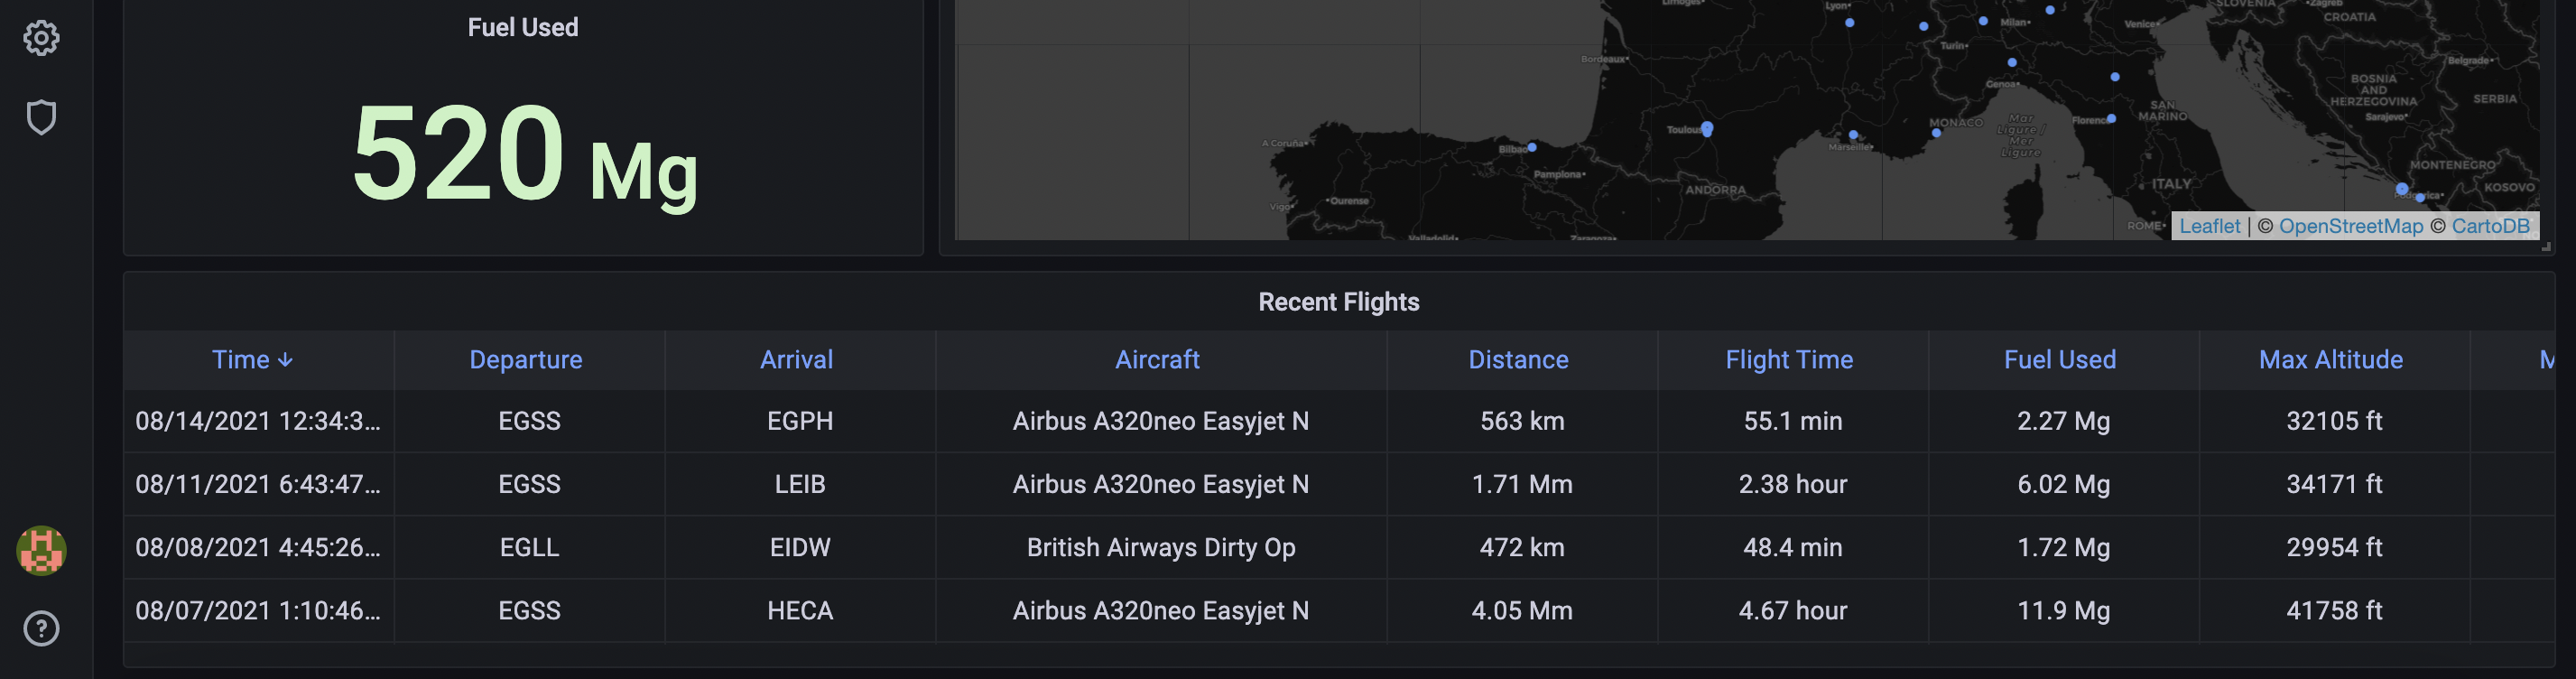
If you scroll down the page, Sam has also added textual data about the most recent (within the specified time period) flights:
Well, that’s it for this one, I hope you found this blog post useful if you’re thinking about playing around with InfluxDB and/or Grafana.