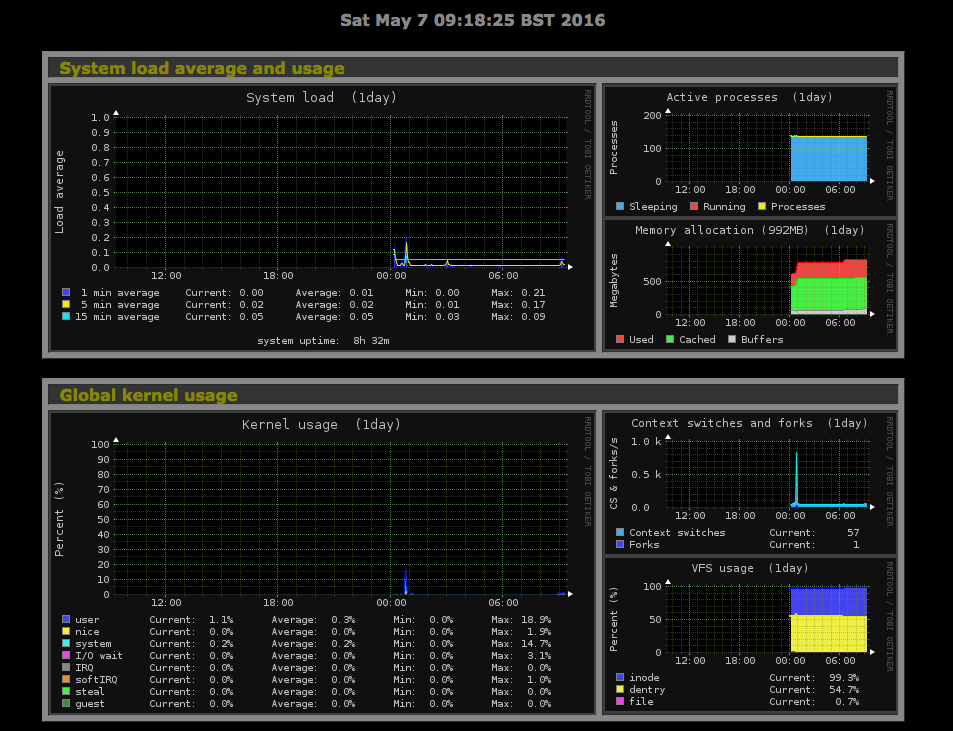
Monitorix is a mature and open-source system monitoring tool for UNIX and Linux; it is written in Perl and is resource-friendly enabling it to be used quite happily on Raspberry Pi’s and embedded devices too.
Although there are other monitoring and graphing tools for Linux that I’ve used before such as Nagios and Cacti, I wanted to customise and create a single dashboard view for all of my Linux servers and therefore really just wanting something small that could monitor, graph (using RRD) and enable me to then embedded the graphs to a custom web page.
Following some research (Googling’) I settled on using Monitorix.
Monitorix works by running a Perl daemon in the background which monitors and record resource usage of system services, network interfaces, HDD temp etc. (these can be customised in the config file explained below) and has a lightweight, embedded web server which then enables you to view the graphs via. a web browser.
I’m running Ubuntu Server 16.04 LTS on most of my servers now but the same instructions should work for older versions of Ubuntu and other versions of Debian too!
First of all we need to add the APT repository to our server (you could alternatively download the .deb and install that way instead if you wanted), so first we’ll edit our sources.list file:
sudo nano /etc/apt/sources.list
At the bottom of the file, add the following lines:
# Monitorix repository
deb http://apt.izzysoft.de/ubuntu generic universe
Next we need to import the GPG key for the repository, run the following command to add it:
wget http://apt.izzysoft.de/izzysoft.asc
sudo apt-key add izzysoft.asc
Now we will need to update our local package list cache, run the following command to pick up the new packages that are now available to us so we can then install Monitorix:
sudo apt-get update
sudo apt-get install monitorix
Excellent! At this point you should now be able to navigate to http://{your_server_ip}:8080/monitorix and assuming that your firewall permits it, you should now see the Monitorix landing page.
Graphs will take a few minutes to start outputting statistics but you’re now up and running.
Personally I prefer to change the default port from 8080 to a different number and remove the /monitorix path requirement from the end, this is possible by updating the monitorix.conf file located in /etc/monitorix/monitorix.conf, after making changes you need to restart the Monitorix daemon by running:
service monitorix restart
If you intend on monitoring your MySQL server, you will need to install the Perl MySQL driver, you can do so by running this command, the MySQL module also requires a non-privileged user to be setup:
sudo apt-get install libdbd-mysql-perl
I also found that initially the statistics for MySQL on my server was not being captured, this was due to the fact that on Debian based systems, there is an addition configuration file found under /etc/monitorix/conf.d/00-debian.conf which was overriding the default MySQL connection parameters of which you will need to update.
I hope you found this useful, I would certainly recommend checking out the configuration file as there are loads of possible features and settings to really customise your setup.

