
Netdata is a fantastic real-time monitoring solution for your Linux based servers and I’ve particularly found it useful for monitoring my web servers.
Netdata provides a web-based dashboard with real-time graphs and alerting; it provides a myriad of information about your servers out of the box and the interface is slick!
Before we start we’ll make sure that we have the latest packages from the apt repository available to us, we’ll run this command…
sudo apt-get update
We can install the software simply by running the following command and accept the new packages that the installer will ask to install (DO NOT use sudo here, it’ll do it automatically if required!)
bash <(curl -Ss https://my-netdata.io/kickstart.sh)
The installer will prompt you to confirm the build and will advise of the file locations etc (shown below) – simply press return to accept them!
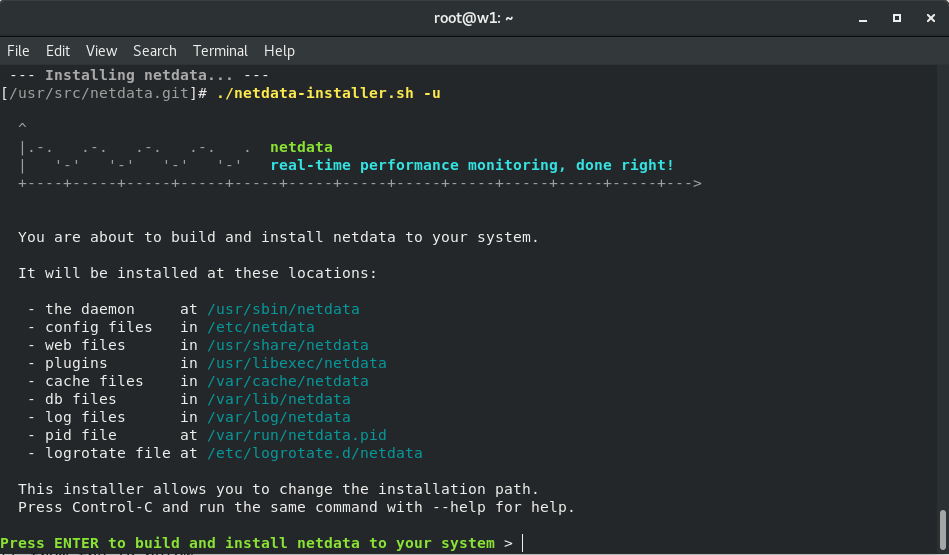
Once you have installed the software, you should then start the daemon and enable it to run at system boot using the following commands:
systemctl start netdata
systemctl enable netdata
By default, Netdata does not monitor Nginx, we need to enable a few things first, lets start by editing our Nginx configuration file and enabling the Nginx stub_status module…
vi /etc/nginx/sites-available/default
Paste the following block of code under the location /{} block:
location /stub_status {
        stub_status;
        allow 127.0.0.1;
        deny all;
}
Now save the file and exit Vim.
We now need to restart Nginx, we can do this by running the following command:
service nginx restart
Assuming all went well, you should now be able to use cURL on the server and “hit” the stub_status endpoint, if it succeeded it means that the Nginx stub_status module is now enabled in Nginx and we can move on…
curl http://127.0.0.1/stub_status
Next up we need to tell Netdata about the Nginx stub_status module, we do this by editing one of Netdata’s configuration files, type the following command:
vi /etc/netdata/python.d/nginx.conf
If the following code block does not exist in the file, add it!
localhost:
  name : 'local'
  url  : 'http://localhost/stub_status'
Finally, save the file and then restart the netdata daemon like so:
systemctl restart netdata
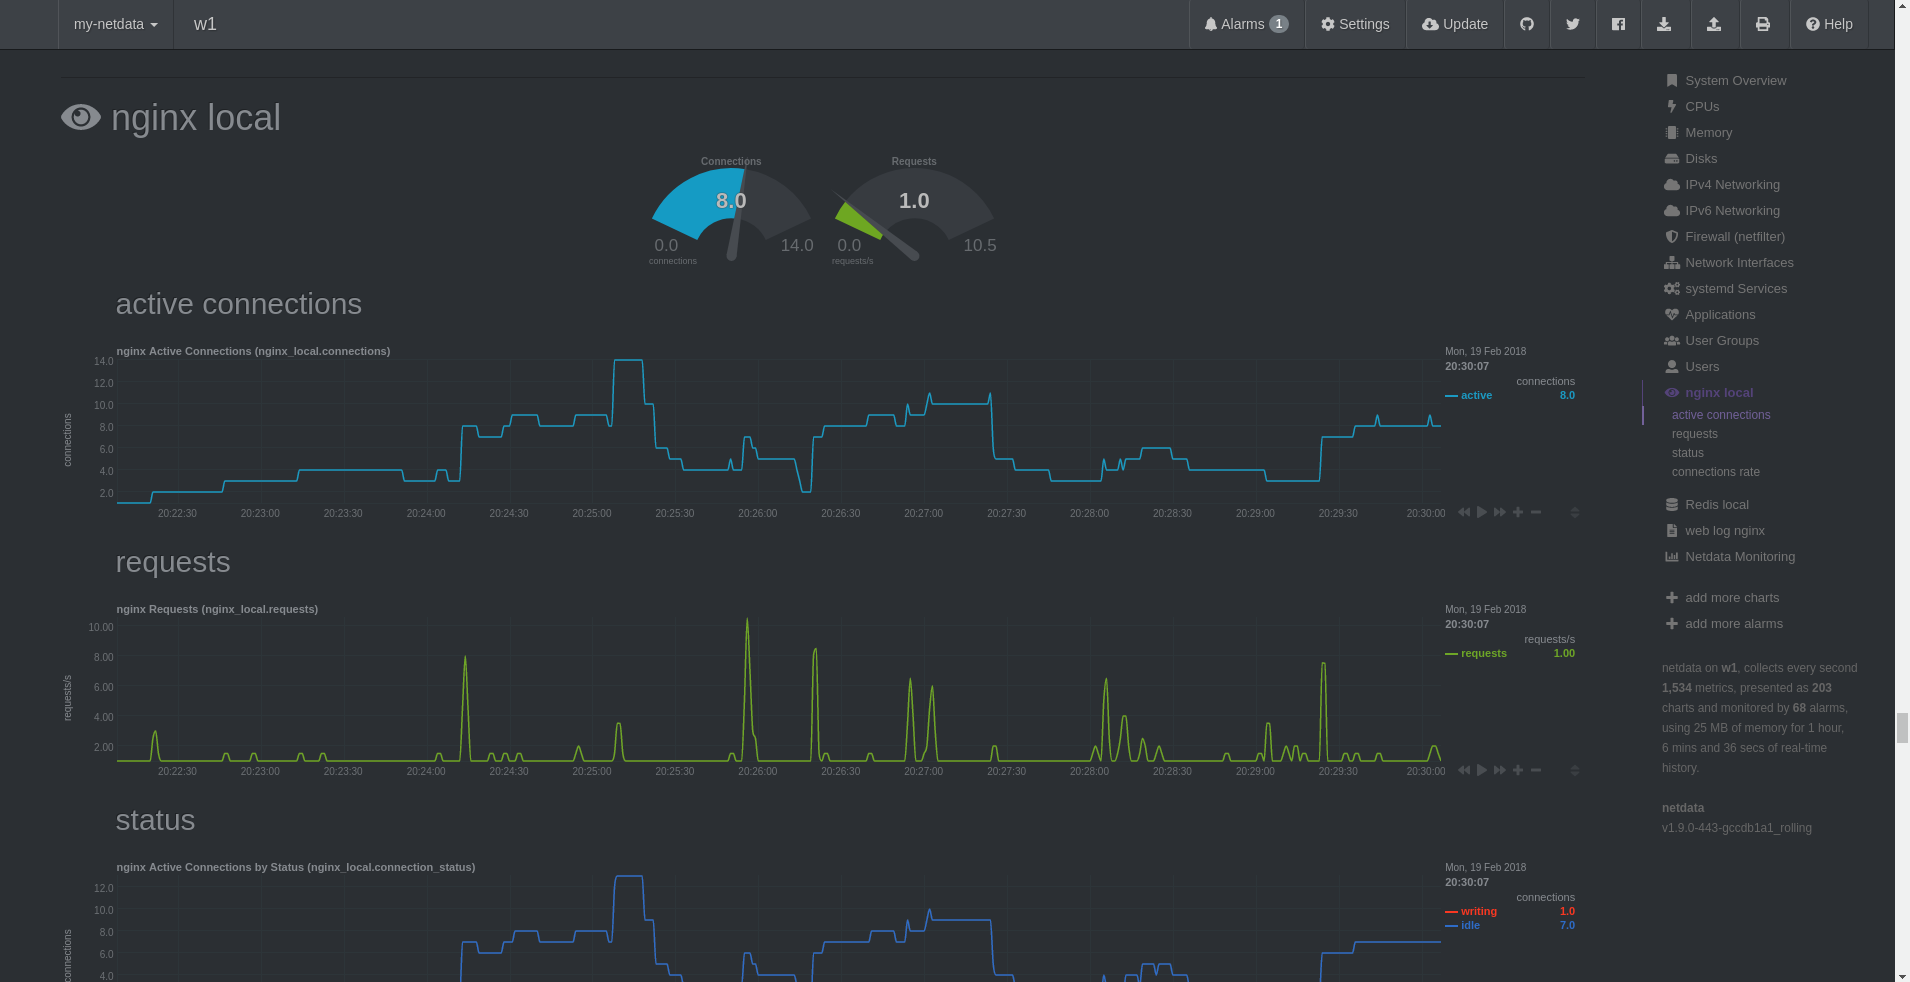
You should now be able to access the monitoring dashboard using the following URL (if you’re using a firewall (which you should be ;)) please ensure you’ve added TCP 19999 to the allowed ports):
http://{your-server-hostname-or-ip-address}:19999/
Your Netdata dashboard is now available to ALL on the internet, it is therefore recommended that you either firewall the connection on TCP 19999 from trusted networks or client IP addresses alternatively, if you have a static IP address you can add it to the /etc/netdata/netdata.conf file like so (in the [web] section):
 allow connections from = localhost 1.2.3.4
 allow dashboard from = localhost 1.2.3.4
Simply replace the example ‘1.2.3.4’ IP address above with your static IP address, you can add as many IP addresses to the configuration by separating each one with a space!
Once you’ve made the required changes you should then restart the netdata daemon in order for the changes to take affect, you can do this by using the following command:
service netdata restart
There are a ton of other plugins you can configure such as the web_log plugin for Nginx, this will provide monitoring for request types, bandwidth and response types, find out more about these plugins and how to enable them at the Netdata website!